Keeping tabs on high-level aspects of your sales process is a great first step in turning your losses into big wins. But, to fully understand exactly where and how you can step up your sales, you don’t want to rely on guesswork—you need to include a win-loss analysis.
The good news is that it’s not as scary to do as it might sound. Here, we’ll guide you through a win-loss analysis, how to perform one, what a good win-loss ratio is, and how you can use templates and tools to automate the process.
Let’s get started.
What Is a Win-Loss Analysis?
A win-loss analysis (and you will see it as “win-loss,” “win/loss,” and even “win loss”) is a data-focused mixture of sales data, market analytics, and research that helps you better understand and fine-tune your go-to-market strategy.
It is also the most important analysis your go-to-market team can have.
Why is that? Because sales leaders often significantly underestimate the number of deals they lose to competitors.
Every go-to-market team will benefit from precise figures if you know you are losing “some” deals to competitors.
This analysis can be individualized to your brand’s particular goals. Still, there are some standard features that a win-loss analysis includes, which we will talk about in the next section.
Ultimately, a win-loss analysis will provide you with a few key takeaways for your team:
- A clear picture of just how many sales opportunities you are losing to your competitors
- Information about competitors’ go-to-market strategy
- Insights about the effectiveness of your go-to-market strategy
- KPIs/sales goals that are individualized to your business
Let’s talk about how you can collect this information by yourself.
How Do You Analyze Win-Loss Data?
If performing a win-loss analysis seems too daunting or is constantly moved to the bottom of your to-do list, this section teaches you how to do it and empowers you to make it an easy, regular part of your strategic research and reporting.
Hint: Leveraging tools to automate a win-loss analysis is much easier!
Step 1: Determine How You Will Collect Your Data
If you already use a sales enablement tool or CRM platform like HubSpot, Salesforce, or Oracle NetSuite, your team should have data about how each sales pitch went that you can then compile into numbers of won vs. lost sales to calculate a simple win-loss ratio.
Converting your CRM sales data into a comprehensive win-loss analysis can be difficult, but you can integrate platforms to interpret the data, which we will discuss later.
If you aren’t familiar with sales enablement tools, you should start here before tackling a win-loss analysis yourself. 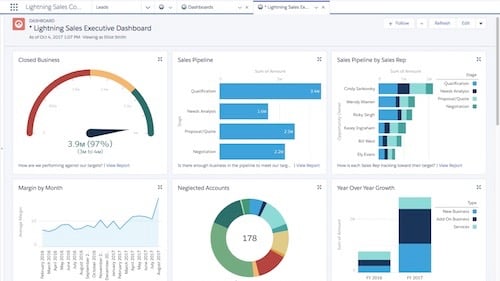
Image credit: Salesforce.
In most CRM platforms, sales representatives can explain why a sale closed vs. why it didn’t in a post-call or meeting note. Typically, you can find a dashboard like the screenshot above that shows your “Closed Business” and “Lost Business.”
This data will give you a very basic win vs. loss ratio (number of won sales for a given period/number of lost sales for a given period) and minor but important insight into why a sale went well or didn’t.
Once you have collected your data by looking at raw figures from your CRM or compiling it in a spreadsheet, you can start digging deeper into customer sentiment.
Step 2: Conduct Prospect Research
Again, many CRMs offer at least a rudimentary notes section where your team can manually enter information about a pitch/call.
But, if you aren’t currently using a CRM, you can still collect this information for later use. It just takes more footwork and spreadsheets.
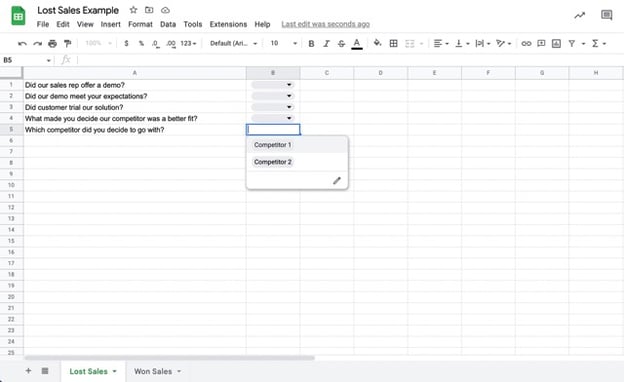
In the example Google Sheet above, a sales rep can choose from two tabs, “Lost Sales” and “Won Sales.” If the prospect in this example decides to go with a competitor, the sales rep can note which competitor from a drop-down menu in the “Lost Sales” tab.
In addition, creating a win-loss survey that you can send out to your prospects via email is important. This message will help you source more granular information about a prospect's (or customer’s) experience.
Not all prospects will answer, but the ones that do often provide invaluable insight into the effectiveness of your strategy. You will want to collect these responses in a spreadsheet or CRM/sales enablement tool as well.
This is typically why many sales leaders and marketing professionals refrain from manually calculating the win-loss ratio. Looking at raw CRM data can be dizzying enough; compiling the data manually after each sales attempt can be overwhelming.
Step 3: Pinpoint Sales Themes
The simple win-loss ratio calculation will only tell you so much. It may reveal that you are losing more sales than winning, which can be very concerning to leadership and your go-to-market team.
But don’t stress just yet. Digging deeper into your data will reveal thematic elements of your marketing and sales process that can help you improve your sales enablement program.

If you’re winning more sales than losing, you can and should continue to build on your progress by doing a comprehensive win-loss analysis.
You can filter information into thematic categories or buckets:
- Success of demos
- Satisfaction with trials
- Price point
- Sales cycle timeline
This is not a comprehensive list. Your research may reveal some unique and useful information you want to include in your report.
Step 4: Do an Individual Competitor Analysis
You will want to look at each of your competitors’:
- Websites
- Blogs
- Social media channels
- Pricing information
- Demo and trial access
- Solution offerings
…and more. Again, this has to be done for each competitor to make it an accurate and complete analysis. This step requires a lot of footwork if you’re not using automation and a single source of truth that the entire team can access (which is where Kompyte shines), but it can be done.
You will want to assess if you post to social media enough compared to your competitors. Do your blog posts display superior content and thought leadership?
Do you have competitive rates?
This is all information you will want to report on.
Step 5: Start Reporting
Once you have combed through everything in your CRM, spreadsheets, and competitors’ digital landscapes, you can generate a manual win-loss analysis report.
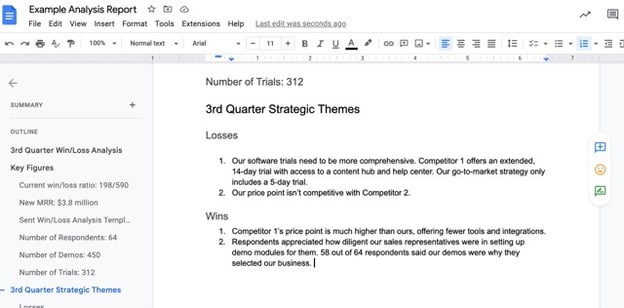
You can include whatever data you prefer in a manual report. Keep your audience in mind as you compile your data. Your leadership team might prefer a more high-level analysis like the example above, or they may want to look at a more comprehensive set of reports.
Or, Make It Easy with Kompyte
Why attempt to do all of that research yourself when you can simplify, synchronize, and automate the process with tools like Kompyte?
Kompyte tracks competitors in real time and organizes information to share across go-to-market teams. Kompyte uses web-based crawlers to pull information from across a competitor’s entire public-facing digital landscape.
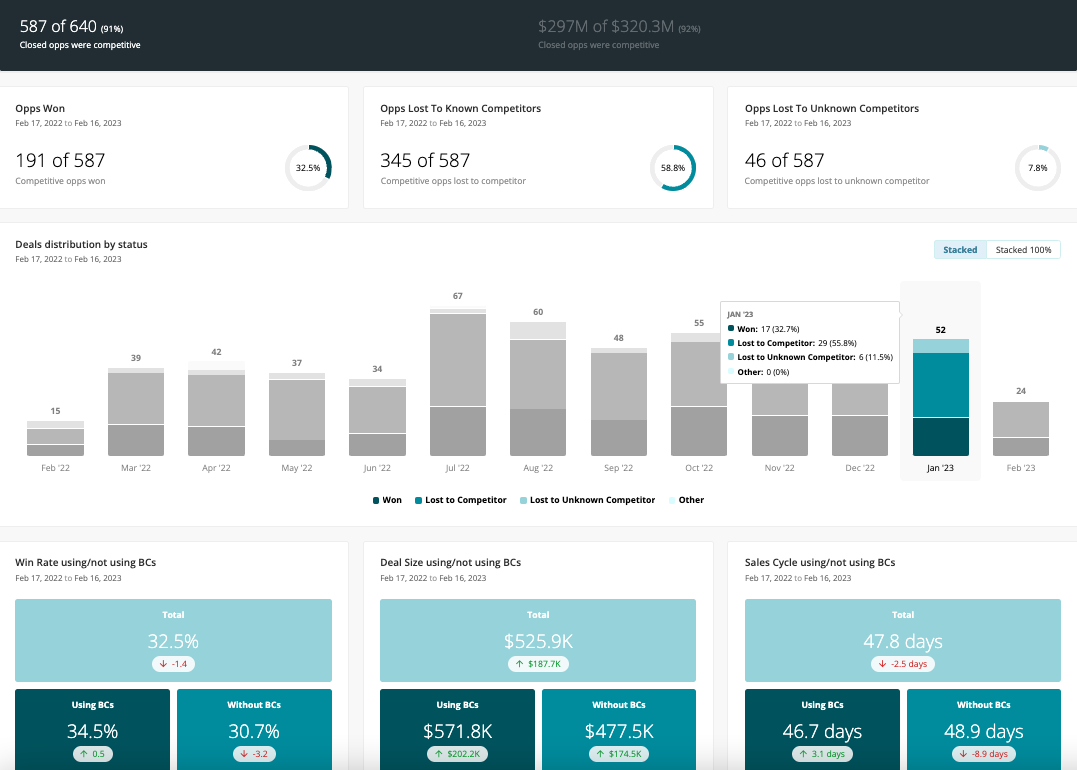
Better yet, Kompyte includes a win-loss analysis tool that generates a sleek reporting dashboard you can filter to get a customized view of all your sales opportunities for a given period of time.
If you conduct formal win/loss interviews, Kompyte can bring those right into your dashboard for easy access and use in Reporting. Read more about our integration with IcebergIQ.
This allows you to focus on building and improving a sales enablement strategy quickly.
To get this analysis, you can integrate your Salesforce account with Kompyte at no additional cost. This allows you to get more information out of your Salesforce data. You can also export your data from any CRM, upload it to Kompyte, and get the same analysis.
You can also build comprehensive Battlecards with Kompyte, instead of wrestling with a very basic call log or note section.
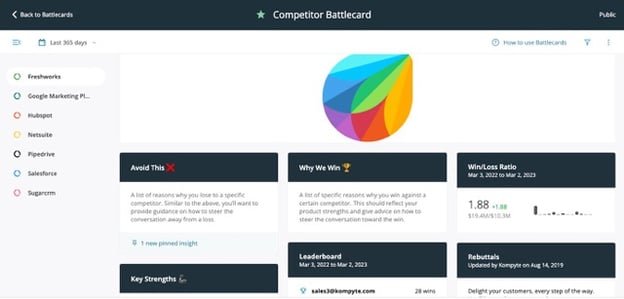
These Battlecards can showcase win-loss insights, competitor research, and key talking points to be used as a playbook or a guide on sales calls. With Kompyte, your sales team can access them right in the sales tools they are already using.
The example above is of a competitor Battlecard. In it, you’ll find sections like:
- Avoid This—a list of reasons you lose to this specific competitor
- Why We Win—a list of reasons why you close deals over this competitor
- Win/Loss Ratio—track how your competitors are performing
- Key Strengths—key strength traits of your competitor
- Leaderboard—top sales people and the number of wins they each have
- Rebuttals—store notes on how you can counter customers who say your competitors do something better than you do
You can also pin and categorize important insights to Battlecards.
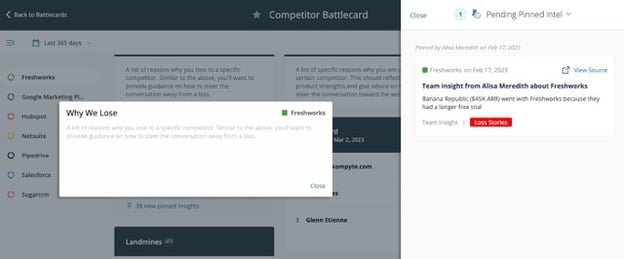
This allows you to save new information about opportunities and competitors as it comes in, creating a living, comprehensive analysis.
And remember how much footwork was involved in manually creating a win-loss analysis? ALL the work is done for you in Kompyte. You can look at all deals and even at deals won against or lost to individual competitors. 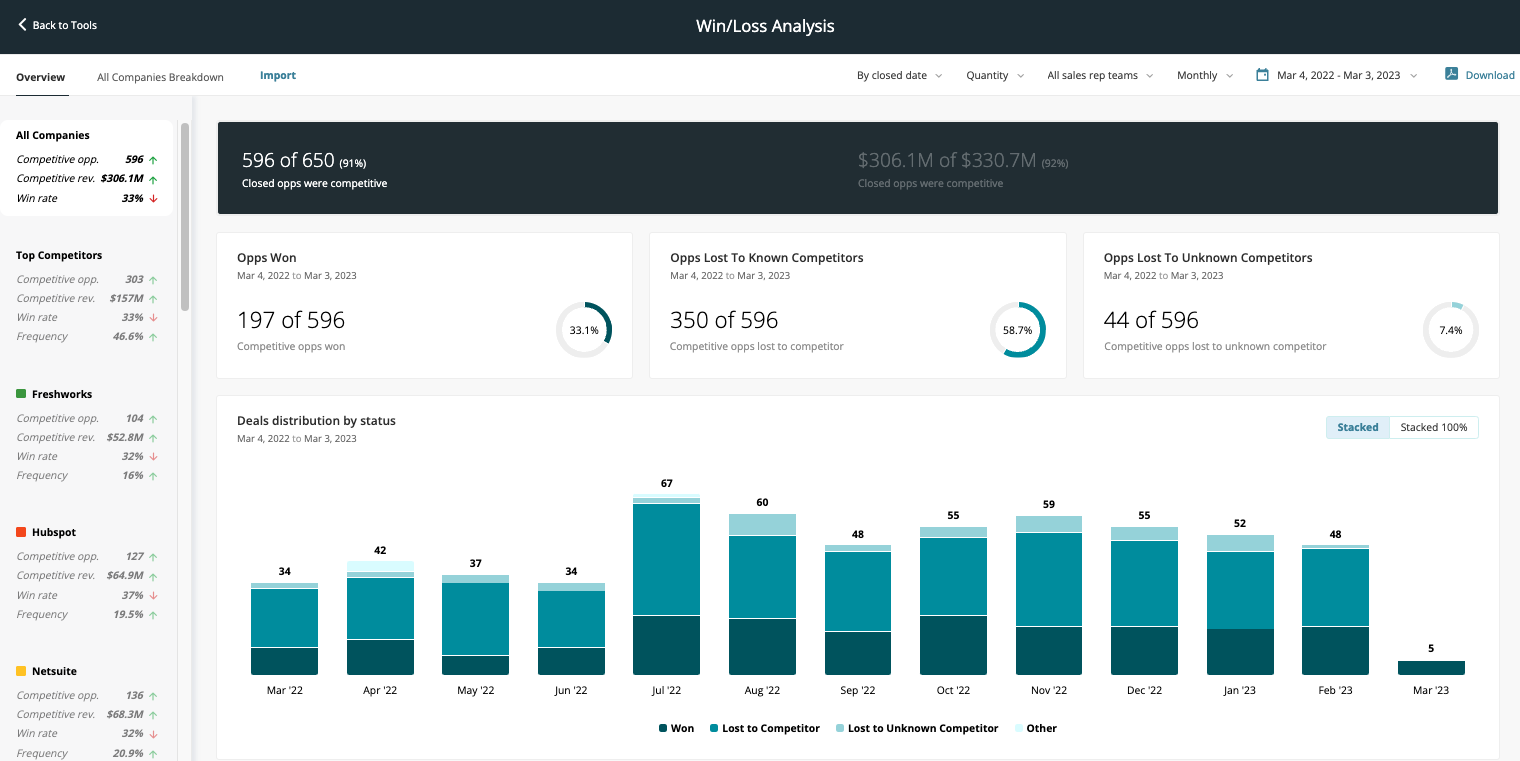
What Is a Good Win-Loss Ratio?
A good win-loss ratio is one that is better than your last month’s win-loss ratio. With win-loss analysis, you are only competing against yourself. It is important to set attainable goals for your team so they feel empowered to help improve the quality and quantity of your opportunities.
Using sales enablement tools like Salesforce and Kompyte makes it possible to accurately gauge performance. Without these platforms, you could be guessing what your ratio was and building an entire improvement plan based on a crystal ball prediction.
While a good win-loss ratio is one that improves month over month, you can also aim for an industry standard if that helps motivate your team. Investopedia lists a quality win-loss ratio as a win rate above 50%.
You’ll also want to help individual sales reps who are falling behind the team average. Encouraging them to adopt official messaging and to reference Battlecards while on sales calls can make a huge difference in their success.

What Is a Win-Loss Summary?
We talked about reporting on win-loss analysis earlier in this article, but you can and should also prepare a win-loss summary. A win-loss summary is a 36,000-foot view of your performance based on the number of deals you’ve closed or lost during a specified period of time.
But, most importantly, a win-loss summary should include a breakdown of individual competitors’ data.
In Kompyte, you can get this summary by looking at the Win/Loss Analysis tool’s “All Companies” tab.
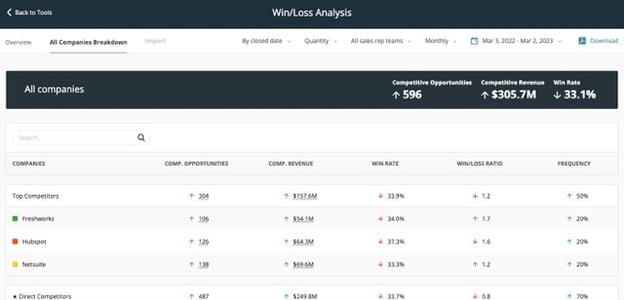
On this page, you get a breakdown of your top, direct, and emerging competitors’ win-loss ratio, how many opportunities they’ve had in a given period of time, their revenue, their win rate, and frequency.
You can download these findings in a PDF file that will be sent directly to your email.
Win-Loss Analysis: Increase Your Wins and Minimize Your Losses
Ultimately, a win-loss analysis is done to help you build on what is working and improve your go-to-market strategy to close more competitive deals.
In order to do that, you need to have clear, comprehensive data. Looking at the overall win-loss rate, the rate for each sales rep, and the rate against each competitor will help you more effectively prioritize your efforts.
You can start with our Sales Performance Template and support your team to increase win rates with our free Battlecard template.